Follow @ChrisMartzWX
It's summer, temperatures are hot - sometimes record hot - and as usual, climate alarmism reaches record highs, and climate activists have a field day with it by fear mongering rather than reasoning with facts and data. Every week, various weather events end up getting caught in the spokes of the wheel of climate; it's an endless cycle. Rinse, wash, repeat. This time, it's the [second] European heatwave.
A Bit of Historical Perspective
While countries like the Netherlands, Germany, and Belgium have recorded their hottest temperatures on record this week, Paris's record high of 108.7°F (42.6°C) on Thursday, July 25 made international headlines and consequently sparked climate insanity.¹
The graph below (Figure 1) shows the maximum temperature in Paris, France for each year since 1900.² As indicated by the red trendline, there has been a noticeable increase in the annual maximum temperature in Paris over the long run, however, the trend is not alarming.
Paris's previous hottest temperature record stood for nearly 72 years.³ On July 28, 1947, the city reached 104.7°F (40.4°C).³ Paris's high of 108.7°F (42.6°C) on Thursday broke the old record by 4°F (2.2°C), which is an incredible feat by any stretch of the imagination. To break an all-time temperature record by 4°F in summer, let alone tie it, is extremely difficult to do, even with global warming.
 |
| Figure 1. Paris, France annual maximum temperature since 1900. |
In Paris, the heatwave lasted for 12 days (July 22 through August 2) with highs consistently at or above 90°F (32.2°C).³ Two days were at or above 100°F (37.8°C), and four were at or above 95°F (35°C).³
What really stuck out to me when comparing maximum temperatures this summer with 1947 is that maximum temperatures seem to trace those of 1947 (Figure 2). It's quite interesting and odd.
 |
| Figure 2. Paris, France daily maximum temperature for the summer of 1947 and 2019. |
Is Climate Change to Blame?
Like most scientists, I agree that climate change - both natural fluctuations or man-made forcings like land use and urbanization - should cause weather patterns and the intensity and/or frequency of extreme weather or weather-related events to change.
It's indeed possible that the warmer atmosphere today as compared to the 1980s may have made this heatwave slightly more intense. However, nobody knows for sure because heatwaves have always occurred; some are just worse than others. It's summer.
While this heatwave is the latest poster child for the "ecological breakdown," there is a natural explanation for this heatwave, as with all other weather events.
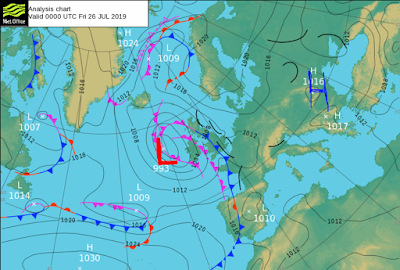
There's been a persistent weather pattern that's causing this bake fest. A large area of high pressure is stationed over Europe and an area of low pressure is situated off of the coast of Ireland.⁴ The wind flow around the pressure centers are drawing in air from the south, which is blowing hot, Saharan air into Europe (Figure 3).⁴ This natural process occurs with or without 415 parts per million (ppm) of carbon dioxide in the atmosphere.
 |
| Figure 3. European surface map. - Met Office. |
 |
| Figure 4. 2-meter relative humidity in France. - weathermodels.com. |
When land is developed, urban infrastructure takes place of land that was once covered with vegetation like grass and particularly forests.⁵ Development limits the amount of plant transpiration (evaporation that cools plant leaves and air temperatures).⁵ Buildings like factories, skyscrapers, houses, and shops, not to mention automobiles and dark urban infrastructure like roads and black roofs absorb and retain more heat than grassy surfaces or forested areas.⁵
All of the heat generated by these objects and surfaces make its way into the atmosphere above the city adding supplemental heat that's not natural.⁵
I've seen some Tweets from a few meteorologists and other people who claim that the UHI is only or mostly effective at night.
While there is some truth to that (as most of the warming seen in the U.S., for instance, is with overnight temperatures), NOAA has created maps from various U.S. cities of both high and low temperatures.⁶ The map below (Figure 5) is of Baltimore, Maryland's 3:00 p.m. afternoon temperature on August 29, 2018.⁶ Notice how the city is noticeably warmer than its more rural surroundings, even in the afternoon! I know this from personal experience because I live in Northern Virginia, not too far from Baltimore and Washington, D.C.
 |
| Figure 5. Baltimore, MD UHI effect. |
My Conclusion
While it's incredible that Paris exceeded their record high on Thursday, it's important that we look not only at trends, but also give a bit of perspective.
One can not make a preconceived notion on one daily temperature measurement.
You have to first look at whether or not a record temperature occurred in an urban area, then see what the upper air pattern is doing, and lastly look at trends and previous years with similar atmospheric conditions.
Skeptics who use cold and snow as evidence that global warming is a hoax are always reminded by climate activists that weather and climate are vastly different, and they'd be correct.
So, why then do activists blame a single record high temperature, let alone a summer heatwave on climate change? That I can not answer. It seems to me that it's "do as I say, not as I do."
The bottom line is this: heatwaves happen, it's summer, and it's hot.
REFERENCES
[1] Leister, Eric. "Paris breaks all-time high temperature as deadly heat wave grips Europe." AccuWeather. July 25, 2019. Accessed July 26, 2019. https://www.accuweather.com/en/weather-news/scorching-heat-produces-all-time-record-highs-in-belgium-netherlands-as-western-europe-swelters-under-heat-wave/70008886.
[2] "Annual Maximum of Monthly Maximum of Daily Maximum Temperature." KNMI Climate Explorer. Accessed July 26, 2019. http://climexp.knmi.nl/data/xgdcnFR000007150_max12_anom_max1_anom.dat.
[3] "Maximum Temperature PARIS/LE BOURGET." KNMI Climate Explorer. Accessed July 26, 2019. http://climexp.knmi.nl/data/xgdcnFR000007150.dat.
[4] "Surface pressure charts." Met Office. July 26, 2019. Accessed July 26, 2019. https://www.metoffice.gov.uk/weather/maps-and-charts/surface-pressure.
[5] "Satellites Pinpoint Drivers of Urban Heat Islands in the Northeast." NASA. Accessed July 26, 2019. https://www.nasa.gov/topics/earth/features/heat-island-sprawl.html.
[6] Herring, David. "Citizen Scientists take to the streets to map the hottest places in ten U.S. cities." NOAA Climate.gov. July 24, 2019. Accessed July 26, 2019. https://www.climate.gov/news-features/features/citizen-scientists-take-streets-map-hottest-places-ten-us-cities.


